Part 1 of a series on making ONCOassist start faster. Every number here is a median of 10 cold starts on a Pixel 7 Pro.
ONCOassist is used by oncology clinicians, often in corridors, between consultations, next to patients. Our cold start was around half a second. That is not a disaster, but we had never actually measured it, so we had no idea whether it was 500ms of unavoidable work or 500ms with easy wins hiding inside.
So I did the boring thing first and built the measurement rig, then let the data pick the optimizations.
Macrobenchmark, briefly
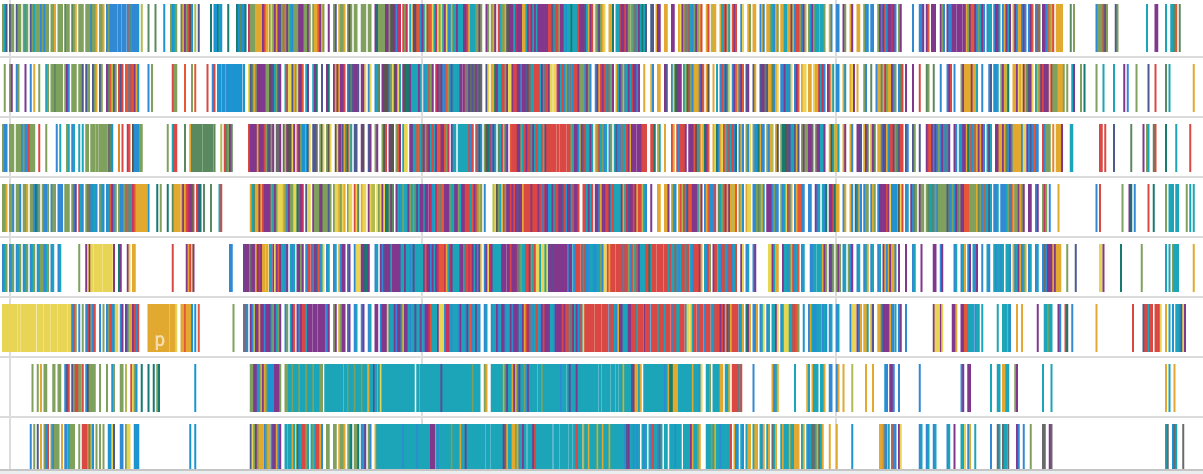
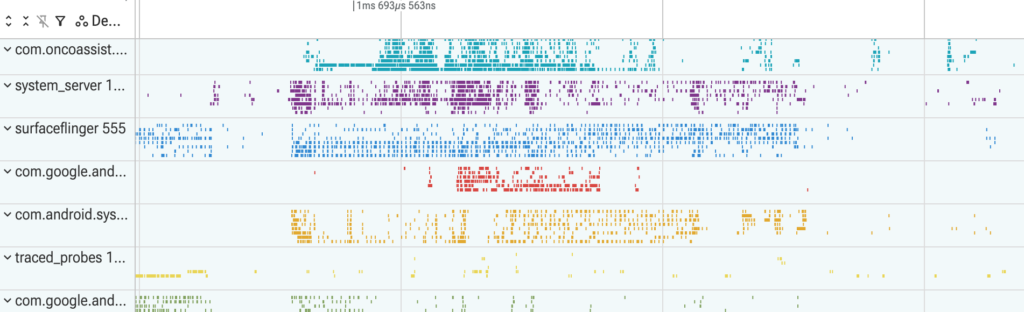
Microbenchmarks measure a function inside your process. Macrobenchmark measures the app the way a user experiences it. A separate test APK cold launches your real, R8 minified, release-signed build and times it from process creation to first frame, collecting a Perfetto trace for every iteration.
It lives in its own Gradle module of type com.android.test.
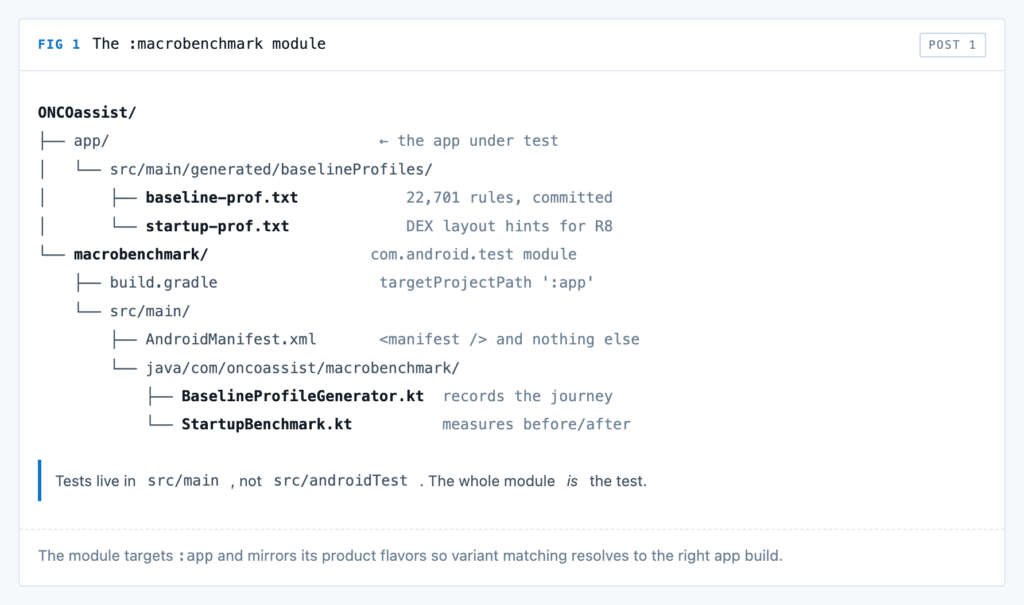
Two details trip people up. The tests live in src/main, because the whole module is the test. The module also declares targetProjectPath ':app' plus a mirror of your app’s product flavors, so variant matching resolves to the right app build.
The part that confused me: two release builds
Applying the androidx.baselineprofile plugin to :app quietly creates two new build types.
nonMinifiedReleasehas R8 off and is used to generate profiles.benchmarkReleasehas R8 on, is release-signed, and is used for measurement.
My first reaction was suspicion. If we generate the profile on an unminified build, are we optimizing the app users actually get?
We are, and the mechanism is worth knowing. Baseline profiles are recorded as source-level method signatures. On every release build, R8 maps those readable names through its own obfuscation mapping and writes a binary profile into the AAB.
A profile recorded on a minified build would only be valid for that one R8 run and useless after it, which is why generation happens on the unminified variant.
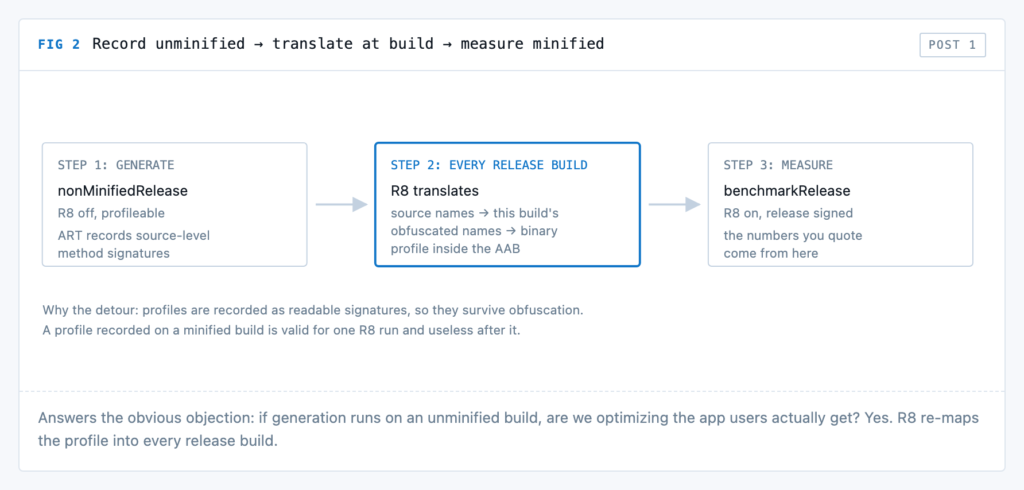
Measurement always runs on the minified build, so the numbers below come from an APK that is very close to what ships.
Three setup gotchas
- Plugin 1.3.4 does not inject
targetAppId. The common template reads the target package from an instrumentation argument that never arrives, and every test throws in under a second. I baked it in per flavor withbuildConfigFieldinstead. - Benchmark variants inherit release signing. Ours fails hard without the keystore, so benchmark builds only work on machines that have it. Worth knowing before you plan CI.
- With
mergeIntoMainset to true and product flavors in play, the per-variant generation tasks disappear. There is one:app:generateBaselineProfiletask, and it scoped itself to our production flavor.
The benchmark itself
One test class holds the whole before and after comparison, because Macrobenchmark can control how the app is compiled.
CompilationMode.None()
CompilationMode.Partial(BaselineProfileMode.Require)- The first wipes the profile so everything is JIT compiled. That is the worst case first launch a real user can hit.
- The second installs your profile the way Play would.
Ten cold starts each, on a physical device. Emulator numbers are useless here. Same APK, two compilation states, so the difference isolates the profile’s effect and nothing else.
The result
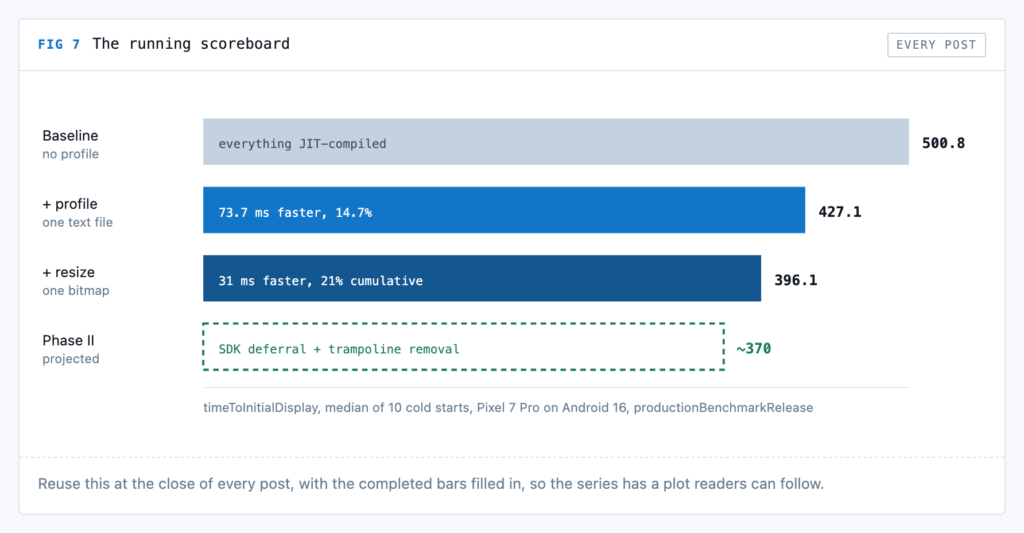
Median of 10 cold starts, measured as timeToInitialDisplay:
- No profile: 500.8 ms
- With baseline profile: 427.1 ms
That is 73.7ms faster, or 14.7%, from committing a generated text file. It sits in the lower half of Google’s advertised 15 to 30% range, and for a reason. 500ms was already a fast start, and profiles help most where there is a lot of JIT work to remove.
Next
That is the setup and the first win. Getting the profile generated took eight attempts and most of a day.
That included a signed, installable APK that was missing 2,598 of its own classes, and a corrupted build cache entry that survived ./gradlew clean. That is Part 2.
Measured on a Pixel 7 Pro running Android 16, productionBenchmarkRelease, Jetpack Macrobenchmark 1.4.1, medians of 10 cold start iterations.
Leave a Reply